WBR technology has been verified in a series of computer simulations, in actual performance tests, as well as on over 500 patients. Below are the results of some of these tests.
WBR technology was first tested using a computerized NM simulator. The simulator creates 2D projections of radiating sources. The sources emit photons, similarly to the emission and detection processes of real radioactive sources. The simulation included a typical high-resolution collimator and camera detectors with a typical 4mm intrinsic resolution.
The emission from 3 radiating point sources (1mm diameter each) was acquired using 120 projections comprising a full 360-degree rotation. The sizes of the matrices in the acquisition and reconstruction process were 128x128, representing a pixel size of about 4x4 mm.
Figure 1 illustrates a reconstructed slice passing through all 3 radiating points. The difference in resolution is significant and easily observed. The Full Width at Half Maximum (FWHM) of the three points reconstructed with the WBR method is 4 mm (or a single pixel size), indicating that WBR indeed compensates for the collimator's beam spread function. Furthermore, the images reconstructed by the common FBP SPECT technique exhibit the well-known effect in which points that are far from the camera’s central axis of rotation appear to have an ellipsoid shape. This phenomenon is due to the rather sharp changes in the collimator’s beam spread as a function of the distance between the collimator face and the point source.
Figure 1. A reconstructed slice passing through all 3 radiating points.
An additional simulation was performed with a line source of 1 mm width that passes through the central axis of rotation. Here again the matrix size was 128x128, representing a pixel size of about 4 mm. Images of three slices along the three principle axes are displayed in Figure 2. As in Figure 1, a significant difference in line resolution between the two reconstruction methods, FBP and WBR, is apparent.
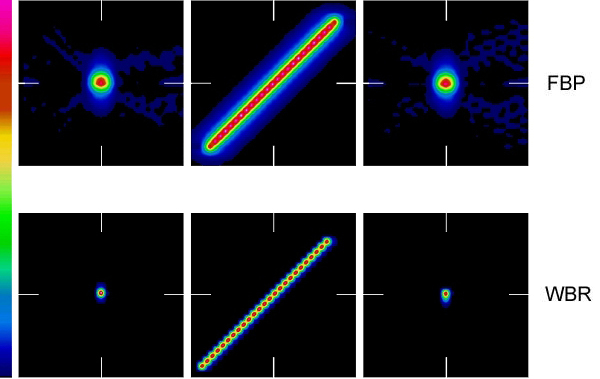
Figure 2. Reconstruction of a simulated line source in 3D space (zoomed).
NEMA Test Results
The standard NEMA SPECT resolution physical tests were performed on a GE Millennium VG, a high-end dual-head gamma camera equipped with HR collimators (VPC-40). The measurements were taken in accordance with the NEMA-2001 protocol, both with and without scatter. The results are shown in the tables below.
Table 1 shows the NEMA SPECT resolution measurements in air. The data indicates the representative average FWHM values of the three points in mm's.
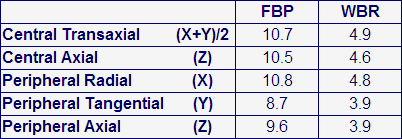
Table 1. NEMA SPECT resolution in air.
Table 2 shows the NEMA SPECT resolution measurements with scatter. The data represents the average FWHM values (in mm) of the three line sources, as defined by NEMA.
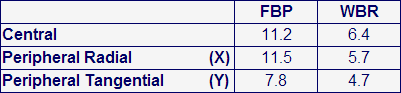
Table 2. NEMA SPECT resolution with scatter.
The results presented here for the FBP method are very similar to the resolution published by the gamma camera manufacturer. The WBR method clearly improves the reconstruction resolution, adjusting for the beam spread function inherent in the system. The resolution enhancement of the clinical images proved to be consistent with the resolution enhancement that was measured in the computer simulations and in subsequent physical tests.
Patient Study
Bone SPECT data of patients (Tc99m) with different indications were processed using current techniques (OSEM and/or FBP) and the WBR technology. The results demonstrate typical improvements in the SPECT data (Figure 3).
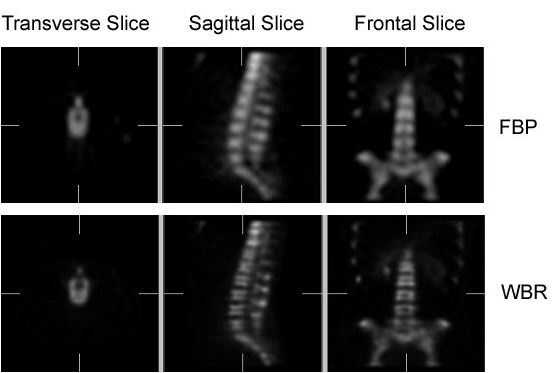
Figure 3. Cross-section view of bone SPECT along the three principle axes.